When liberals and leftists attempt to justify mass immigration, they will claim it is necessary or even "good" for the economy. No one doubts that increasing the population can grow the economy, and bankers and big business would be delighted. But for the ordinary working man, wealth per capita is of greater relevance.
From an examination of long-term net migration into the UK over the period 1980 to 2015, and a comparison with the increase in GDP per capita over the same years, the correlation coefficient was found to be weakly negative at R = -0.122 for n = 36, at a 95% confidence interval from -0.433 to 0.215.
The results were more intriguing after allowing for the fact that immigration levels over particular years could affect the economy in later years. When immigration over each two-year period was compared with GDP per capita growth for the following two years, the correlation was moderately negative at R = -0.518, with a sample n of 17. The 95% confidence interval was from -0.799 to -0.049. Increasing the time between the immigration figures and the period of economic growth under consideration resulted in a further increase in the negative correlation.
The UK had a highly positive net migration over the second half of the period, from 1998-2015. Over that time the increase in GDP per capita is lower than in the first half of the period, when immigration was substantially lower. Poland, by contrast, has negative net migration. Over 1998-2015, its growth was not only higher than in preceding years, but was more than twice the value for the UK.
Thus, we can rule out the possibility that mass immigration offers any significant improvement to wealth per capita, and its effect on the finances of most individuals is very likely to be negative.
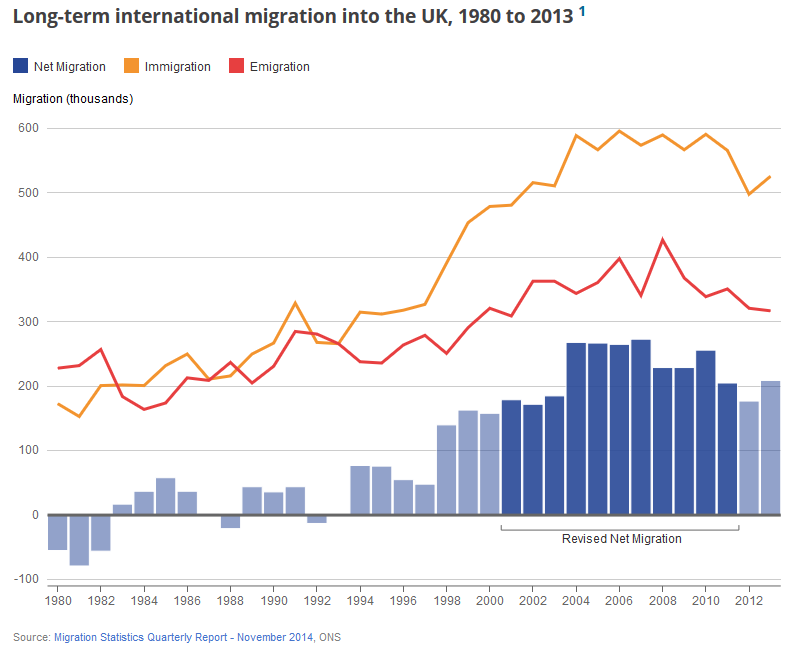
On the graph below, it can be seen that immigration into the UK suddenly began accelerating after 1997, with the election of Tony Blair. It was subsequently admitted that this was no accident. The policy was deliberate, in order to socially engineer a "truly multicultural" country, and to "rub the Right's nose in diversity".

Source: Office for National Statistics
The raw data may be downloaded from that page, and is also shown below in the Appendix. There are a couple more years to take us up to 2015.
Net long-term migration to the UK (immigration less emigration) was estimated to be 318,000 in the calendar year 2014. Immigration was 641,000 and emigration 323,000.
And net long-term migration to the UK was 333,000 in the calendar year 2015. Immigration was 630,000 and emigration 297,000.
Now when the 1980-1997 period is compared to the 1998-2015 period, it may be seen in the graph below that the annual increase in GDP tends to be lower in the latter period. When compared to the former, both the peaks and the troughs are lower.
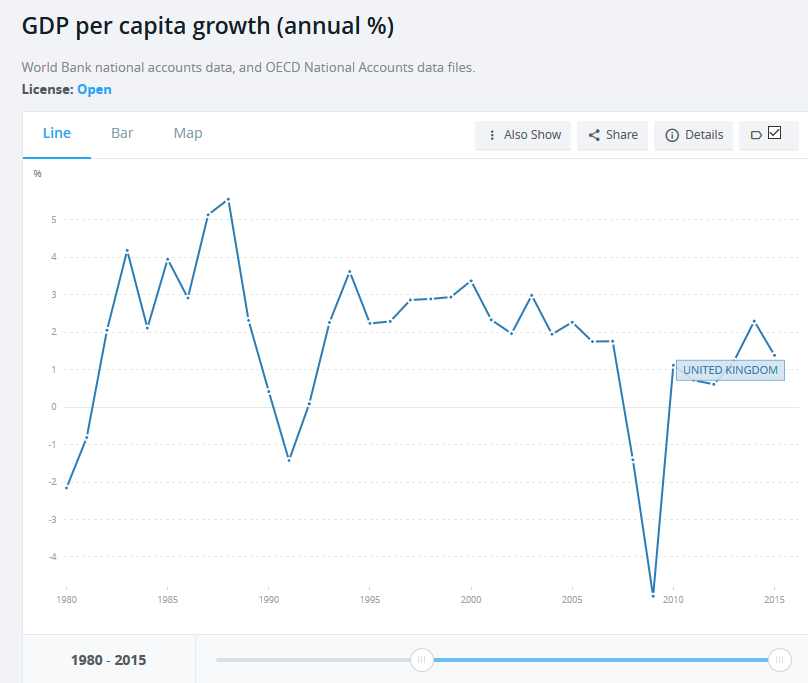
Source: The World Bank
That's "Annual percentage growth rate of GDP per capita based on constant local currency. Aggregates are based on constant 2010 U.S. dollars. GDP per capita is gross domestic product divided by midyear population." (See Appendix or source for further details.)
Firstly, here's a quick comparison of the pre-Blair 1980-1997 period to the 1998-2015 period.
In 1979, GDP per capita was 14417. In 1997, GDP per capita was 20836. In 2015, GDP per capita was 26653.
The first period from 1980-1997 has total net migration of 306,000 and a total increase in GDP per capita of 44.524%. That's an average of 2.067% per annum compounded.
The next period from 1998-2015 has total net migration of 4,026,000 and a total
increase in GDP per capita of 27.918%. That's an average of 1.377% per annum
compounded.
Now we'll consider each year in turn from 1980-2015 and find what correlation is
observed between net migration and GDP growth per capita for that year. The
percentage growth is calculated by dividing the GDP per capita for that year by
the GDP per capita for the preceding year.
(For calculating the 1980 growth, the 1979 GDP per capita at constant LCU is 14417.)
| Year | Net long-term migration (thousands) | GDP per capita (constant LCU) | Growth in GDP per capita (%) |
| 1980 | -55 | 14106 | -2.157 |
| 1981 | -79 | 13991 | -0.815 |
| 1982 | -56 | 14278 | 2.051 |
| 1983 | 17 | 14875 | 4.181 |
| 1984 | 37 | 15190 | 2.118 |
| 1985 | 58 | 15790 | 3.950 |
| 1986 | 37 | 16250 | 2.913 |
| 1987 | 2 | 17085 | 5.138 |
| 1988 | -21 | 18033 | 5.548 |
| 1989 | 44 | 18451 | 2.318 |
| 1990 | 36 | 18528 | 0.417 |
| 1991 | 44 | 18264 | -1.425 |
| 1992 | -13 | 18280 | 0.088 |
| 1993 | -1 | 18694 | 2.265 |
| 1994 | 77 | 19371 | 3.621 |
| 1995 | 76 | 19804 | 2.235 |
| 1996 | 55 | 20257 | 2.287 |
| 1997 | 48 | 20836 | 2.858 |
| 1998 | 140 | 21439 | 2.894 |
| 1999 | 163 | 22069 | 2.939 |
| Year | Net long-term migration (thousands) | GDP per capita (constant LCU) | Growth in GDP per capita (%) |
| 2000 | 158 | 22814 | 3.376 |
| 2001 | 179 | 23346 | 2.332 |
| 2002 | 172 | 23804 | 1.962 |
| 2003 | 185 | 24515 | 2.987 |
| 2004 | 268 | 24992 | 1.946 |
| 2005 | 267 | 25559 | 2.269 |
| 2006 | 265 | 26007 | 1.753 |
| 2007 | 273 | 26464 | 1.757 |
| 2008 | 229 | 26092 | -1.406 |
| 2009 | 229 | 24775 | -5.048 |
| 2010 | 256 | 25052 | 1.118 |
| 2011 | 205 | 25232 | 0.719 |
| 2012 | 177 | 25386 | 0.610 |
| 2013 | 209 | 25699 | 1.233 |
| 2014 | 318 | 26289 | 2.296 |
| 2015 | 333 | 26653 | 1.385 |
The Pearson's correlation coefficient R is -0.122. Given that the sample size n is 36, the 95% confidence interval is from -0.433 to 0.215. From this the economic effect of mass migration is likely to be quite small, but more likely negative than positive.
Since migration in a particular year would also affect the economy in subsequent years, and the economy in any given year would be influenced by migration in the preceding years, the effect is likely to be indicated by the change in average growth from earlier years that had relatively low migration to later years with higher migration. And as we saw, 1980-1997 had total net migration of 306,000 and a total increase in GDP per capita of 44.524%, which averages 2.067% growth per annum compounded. 1998-2015 had total net migration of 4,026,000 and a total increase in GDP per capita of 27.918%, which is 1.377% growth per annum compounded.
We can compare migration in sets of earlier years to economic growth in sets of later years, or consider longer periods over several years. Let's start with the latter, by dividing the 36 years into six sets of six years' duration.
The net migration over a particular set of years is found from the table above, by simply adding migration for all years within the set. For the GDP per capita growth over a particular set of six years, we divide the GDP per capita for the final year in the set by the GDP per capita for the final year of the previous 6-year segment. For example, the period 1980 to 1985 has per capita growth of 15790 / 14417, which is 9.523%.
Here are the results for the 6-year blocks:
| Years | Net long-term migration (thousands) | Growth in GDP per capita (%) |
| 1980-1985 | -78 | 9.523 |
| 1986-1991 | 142 | 15.668 |
| 1992-1997 | 242 | 14.082 |
| 1998-2003 | 997 | 17.657 |
| 2004-2009 | 1531 | 1.061 |
| 2010-2015 | 1498 | 7.580 |
The Pearson's correlation coefficient is -0.543, which is a moderately negative correlation.
(Comma-separated variables may be inputted at this page to find the coefficient. The comma-separated values are shown below.)
-78,142,242,997,1531,1498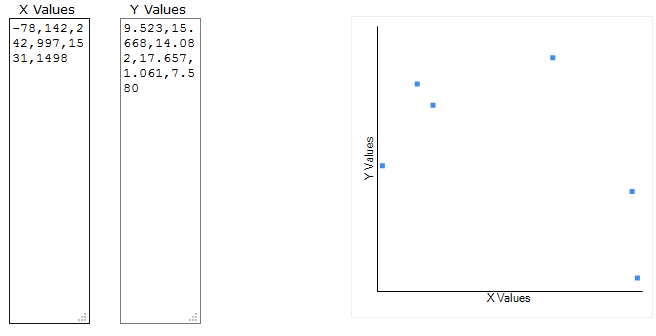
18 lots of two years (1980/1, 1982/3, etc.).
-134,-39,95,39,23,80,-14,153,103,303,337,357,535,538,458,461,386,651
-2.955,6.318,6.151,8.201,7.995,-1.013,2.354,5.938,5.211,5.918,5.786,5.007,4.259,3.541,-6.382,1.845,1.851,3.712
R = -0.132.
12 lots of three years.
-190,112,18,124,63,179,461,536,800,731,638,860
-0.964,10.59,14.205,1.281,6.061,7.563,9.493,7.456,6.086,-4.737,2.466,4.991
R = -0.204
9 lots of four years.
-173,134,103,139,406,694,1073,919,1037
3.177,14.857,6.901,8.432,11.437,11.083,7.95,-4.655,5.632
R = -0.262
Here's a summary of all results so far, including the confidence intervals. (To find the confidence interval, input the observed correlation R and the sample size n at this page.)
For 36 lots of 1 year, R = -0.122 and 95% CI is from -0.433 to 0.215.
For 18 lots of 2 years, R = -0.132 and 95% CI is from -0.564 to 0.357.
For 12 lots of 3 years, R = -0.204 and 95% CI is from -0.696 to 0.419.
For 9 lots of 4 years, R = -0.262 and 95% CI is from -0.789 to 0.487.
For 6 lots of 6 years, R = -0.543 and 95% CI is from -0.940 to 0.481.
Now let's consider the correlation between migration over each 2-year period with economic growth over the following two years.
| Years | Net long-term migration (thousands) | Growth in GDP per capita (%) |
| 1980/1 | -134 | -2.955 |
| 1982/3 | -39 | 6.318 |
| 1984/5 | 95 | 6.151 |
| 1986/7 | 39 | 8.201 |
| 1988/9 | 23 | 7.995 |
| 1990/1 | 80 | -1.013 |
| 1992/3 | -14 | 2.354 |
| 1994/5 | 153 | 5.938 |
| 1996/7 | 103 | 5.211 |
| 1998/9 | 303 | 5.918 |
| 2000/1 | 337 | 5.786 |
| 2002/3 | 357 | 5.007 |
| 2004/5 | 535 | 4.259 |
| 2006/7 | 538 | 3.541 |
| 2008/9 | 458 | -6.382 |
| 2010/1 | 461 | 1.845 |
| 2012/3 | 386 | 1.851 |
| 2014/5 | 651 | 3.712 |
This is intriguing, since the correlation coefficient R is now moderately negative at -0.518, with a sample n of 17. Now the 95% confidence interval is from -0.799 to -0.049.
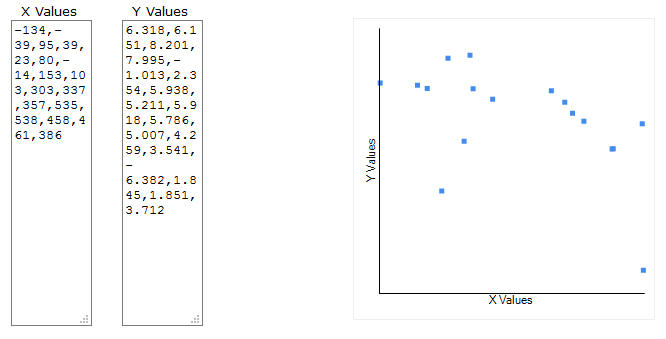
Here's the data that was used:
-134,-39,95,39,23,80,-14,153,103,303,337,357,535,538,458,461,386
6.318,6.151,8.201,7.995,-1.013,2.354,5.938,5.211,5.918,5.786,5.007,4.259,3.541,-6.382,1.845,1.851,3.712
Next, let's try looking at migration figures against the next but one set of two years for economic growth, so that we have migration for 1980/1 against economic growth for 1984/5, and so on. We remove the final 386 from the migration data above, and remove the initial 6.318 from the growth figures.
The correlation is a little more negative, at -0.550. Now the sample size n is 16, and the 95% confidence interval is from -0.821 to -0.074.
Next, we'll look at how 1980/1 migration compares to economic growth for 1986/7 and so on. Remove what is now the final 461 from the migration figures, and remove what is now the initial 6.151 from the growth figures.
The value of R is intermediate between the above two, at -0.530. The sample size is 15 and the 95% CI is from -0.819 to -0.024.
An interesting country for financial comparisons is Poland, where the natives say, "We don't want terrorists here", and "People just don't want immigrants here. They don't understand them, they don't like them, and believe that their maintenance is too expensive." A 2013 study by the Centre for Research on Prejudice showed that 69% of Poles do not want "non-white" people living in their country. And so Poland accepts "vanishingly small" numbers of migrants.
Poland's net migration is negative with emigrants exceeding immigrants, and even by 2006, immigration per se was still barely over 10,000 annually. 94% of Poland's population is Polish.
The World Bank data for Poland's GDP per capita in terms of constant local currency unit (LCU) only goes back to 1990. Knoema has GDP per capita from 1980 at current US$ values. So let's take these figures and do a direct comparison with the UK.
For Poland, the GDP per capita figures are 1591.9, 4068.0 and 12492.2 for 1980, 1997 and 2015 respectively. So for 1981-1997 the growth totals 155.544% and for 1998-2015 the growth totals 207.085%. The latter period covers one extra year, but there's no slowdown. The average annual compounded increase is 5.674% over 1981-1997 and 6.431% over 1998-2015.
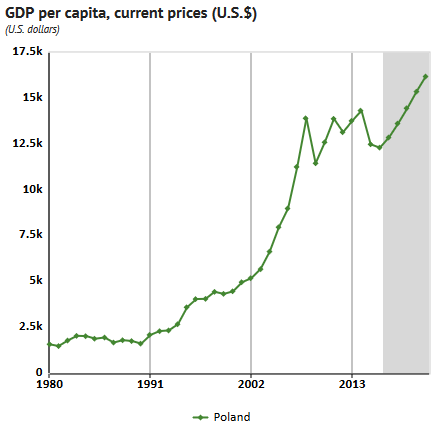
Being under the communist yoke until 1989 could explain Poland's poorer performance in the late 1980s, but that would not explain why its growth rate was more than double the UK rate over 1998-2015.
For the UK, with its increasingly positive net migration, the GDP per capita figures are 10671.7, 26366.9, 43902.4 for 1980, 1997 and 2015 respectively. So for 1981-1997 the growth totals 147.073% and for 1998-2015 the growth totals 66.506%. There certainly is a slowdown in growth. The average annual compounded increase is 5.465% over 1981-1997 and 2.873% over 1998-2015.
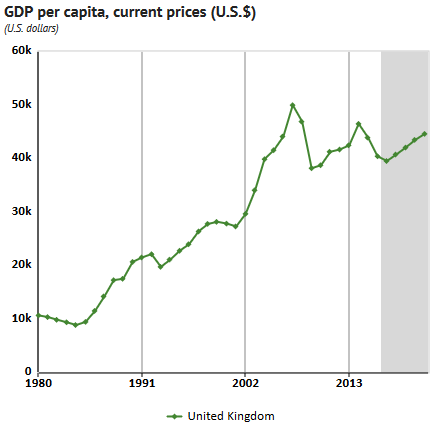
Finally, let's do a direct comparison of Poland and the UK at constant LCU, from the World Bank data for 1990-2015. Before even starting any calculations, the comparison speaks for itself in the graph.
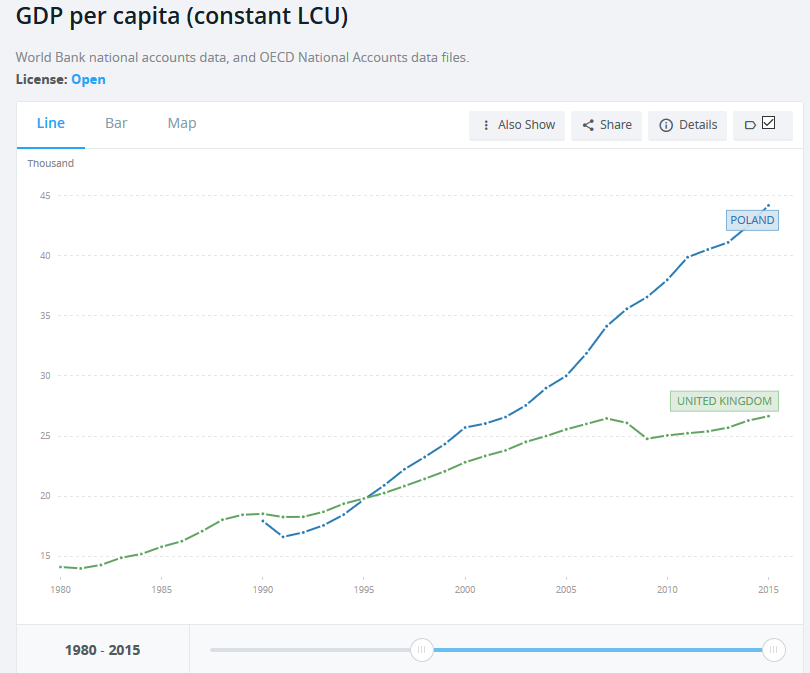
At constant LCU, Poland has GDP per capita of 17933, 22234 and 44190 for 1990, 1997 and 2015 respectively. So for 1991-1997 the total growth is 23.984%, which is 3.119% annually compounded. For 1998-2015 the total growth is 98.750%, an average of 3.890% annually compounded over the eighteen years.
And at constant LCU, the UK has GDP per capita of 18528, 20836 and 26653 for 1990, 1997 and 2015 respectively. For 1991-1997 the total growth is 12.457%, which is 1.691% annually compounded. For 1998-2015 the total growth is 27.918%, which is an average of 1.377% annually over the eighteen years.
Thus, Poland, with its negative net migration and limited immigration, increased its growth over the same 1998-2015 period when the UK, buffeted by high positive net migration and high immigration, experienced a slowdown in growth.
Mass immigration brings many problems, which include but are not limited to:
The indigenous population will inevitably become a minority in their own lands under present policies, which is why it is time to call a halt to the insanity.
And given that mass immigration brings undeniable disadvantages without economic benefits for the average citizen, the case for an immediate change of course by rejecting the suicidal cult of globalism becomes even stronger.
Certainly, there are winners as well as losers from mass immigration. Big business will have an ample supply of cheap labor. Politicians love it because the increased population probably leads to a higher GDP (before dividing it by the increased population), and so they may be able to say that their country has the n-1th biggest economy instead of the nth biggest economy. And bankers love it because their profits are based upon the total GDP rather than GDP per capita.
Part of the case for mass immigration is that the immigrants are generally assumed to be relatively young adults who will be hard-working, healthy, and will help to pay for the pensions of an aging native population. However, if this were the case, one would expect to see economic benefits appearing sooner rather than later, and there is no evidence of such benefits.
On the other hand, negative effects such as crime, more handouts, and increased strain on infrastructure will be partly a result of high immigration rates in previous years, and so will take some time to show up in full.
There is a particular group who are behind the drive to impose "diversity" upon the rest of us. See here for further details.
It is clear that the vast majority of the indigenous population have very little to gain, and a great deal to lose, from mass immigration. Maybe there are some misguided folk who like the idea of being a "melting pot" for a wide range of cultures and religions, some of which are wholly incompatible with white European civilization. However, if these people like "diversity" and "multiculturalism" so much, then why not set up such a state, or adapt an existing one - say, on the eastern shores of the Mediterranean, where they can live in the Utopia of their dreams? This would enable the rest of us to retain our own homelands, populated by people who share our traditions, culture and values.
Ironically, the policy of mass immigration could be considered a policy of the extreme right-wing, since it favors a privileged minority at the expense of the vast majority, the indigenous population who are the rightful owners of the land.
It is time for all politicians who call for and vote for mass immigration to be voted out of office, and for those who still do not get the message, to be arrested and tried for subversion and treason.
Here's the raw data, obtained from the Office for National Statistics
"Long-term international migration into the UK, 1980 – 2013",,,
Year,Net Migration (thousands),Immigration (thousands),Emigration (thousands)
1980,-55,173,228
1981,-79,153,232
1982,-56,201,257
1983,17,202,184
1984,37,201,164
1985,58,232,174
1986,37,250,213
1987,2,211,209
1988,-21,216,237
1989,44,250,205
1990,36,267,231
1991,44,329,285
1992,-13,268,281
1993,-1,266,266
1994,77,315,238
1995,76,312,236
1996,55,318,264
1997,48,327,279
1998,140,391,251
1999,163,454,291
2000,158,479,321
2001,179,481,309
2002,172,516,363
2003,185,511,363
2004,268,589,344
2005,267,567,361
2006,265,596,398
2007,273,574,341
2008,229,590,427
2009,229,567,368
2010,256,591,339
2011,205,566,351
2012,177,498,321
2013,209,526,317
"1. Net migration estimates for the period 2001 – 2011 have been revised in light of the 2011 Census. Therefore, they will not be consistent with the separate immigration and emigration figures shown. "
Here's the annual percentage rate for GDP per capita growth (constant LCU) for the UK from The World Bank, and the definition:
"Annual percentage growth rate of GDP per capita based on constant local currency. Aggregates are based on constant 2010 U.S. dollars. GDP per capita is gross domestic product divided by midyear population. GDP at purchaser's prices is the sum of gross value added by all resident producers in the economy plus any product taxes and minus any subsidies not included in the value of the products. It is calculated without making deductions for depreciation of fabricated assets or for depletion and degradation of natural resources.","World Bank national accounts data, and OECD National Accounts data files."
(This is 1980-2015.)
"-2.15817221783044","-0.813470659752994","2.05224379254089","4.18503805865116","2.11283337903383","3.95111940338478","2.91461504920851","5.13568915707465","5.55274497827899","2.31620730529391","0.416258978843743","-1.42429921643097","0.0888346766506913","2.26155214400154","3.62093378945781","2.23555327198748","2.28795043245518","2.86191273366994","2.89051287088353","2.93956885488637","3.37494220802566","2.33139676773378","1.96467902260518","2.98557749822166","1.9462080959218","2.26749943338029","1.75232387863475","1.76035273472944","-1.40623189568478","-5.04866390896494","1.11938353269588","0.718681635361861","0.611016523473722","1.23102840989606","2.29692029727869","1.38503837338536"
And here's the GDP per capita (constant LCU) that the above figures are based on.
(This is 1979-2015.)
"14416.7011701665","14105.5639307844","13990.8193068147","14277.9450275645","14875.4824609613","15189.7766196888","15789.9428310402","16250.1588810551","17084.7165287168","18033.3872678184","18451.0779011075","18527.8821695643","18263.989689002","18280.2144451857","18693.6310268989","19370.5150292284","19803.5532117652","20256.6486931152","20836.3763014783","21438.6544402983","22068.858449132","22813.6696677612","23345.5468249968","23804.21188618","24514.9050798828","24992.016147255","25558.7099717843","26006.5813496909","26464.3889156898","26092.2382377593","24774.9288228084","25052.2552962881","25232.3012543465","25386.4747842632","25698.9895011286","26289.2748071755","26653.3913513396","",
[We have taken the GDP per capita to the nearest pound and calculated annual growth from that. The raw data from The World Bank is calculated to a greater precision, and so some growth figures differ in the third decimal place.]
Below is the data used for the 2-year, 3-year and 4-year periods (years, net migration in 000s, GDP per capita growth in %).
1980-1 -134 -2.955
1982-3 -39 6.318
1984-5 95 6.151
1986-7 39 8.201
1988-9 23 7.995
1990-1 80 -1.013
1992-3 -14 2.354
1994-5 153 5.938
1996-7 103 5.211
1998-9 303 5.918
2000-1 337 5.786
2002-3 357 5.007
2004-5 535 4.259
2006-7 538 3.541
2008-9 458 -6.382
2010-1 461 1.845
2012-3 386 1.851
2014-5 651 3.712
1980-2 -190 -0.964
1983-5 112 10.590
1986-8 18 14.205
1989-91 124 1.281
1992-4 63 6.061
1995-7 179 7.563
1998-2000 461 9.493
2001-3 536 7.456
2004-6 800 6.086
2007-9 731 -4.737
2010-2 638 2.466
2013-5 860 4.991
1980-3 -173 3.177
1984-7 134 14.857
1988-91 103 6.901
1992-5 139 8.432
1996-9 406 11.437
2000-3 694 11.083
2004-7 1073 7.950
2008-11 919 -4.655
2012-5 1037 5.632